Market Outlook
October 26, 2017
Market Cues
Domestic Indices
Chg (%)
(Pts)
(Close)
Indian markets are likely to open Negative tracking global indices and SGX Nifty.
BSE Sensex
1.3
435
33,043
The S&P 500 and the Dow on Wednesday posted their biggest one-day declines in
Nifty
0.9
88
10,295
more than seven weeks on a string of disappointing earnings, even as the stock
Mid Cap
0.4
68
16,249
market pared early losses. Profit taking could also be the trigger for to the weakness
Small Cap
(0.2)
(32)
17,159
on Wall Street after the Dow climbed to a new record closing high in the previous
session. The S&P500 dropped 0.5% to close at 2,557, The Dow Jones Industrial
Bankex
4.7
1,274
28,329
Average fell 0.48% to end at 23,329. NASDAQ shed 0.5% to finish at 6564.
Global Indices
Chg (%)
(Pts)
(Close)
UK Stocks closed lower after a stronger than expected reading on the British
Dow Jones
(0.5)
(112)
23,329
economic growth drove the pound up against the US dollar and the Euro. The FTSE
Nasdaq
(0.5)
(35)
6,564
100 index UKX, fell 1.1% to end at 7447.
FTSE
(1.1)
(79)
7,447
On domestic Front, India shares rose sharply to hit fresh record high on Wednesday
Nikkei
0.1
31
21,739
as PSU Banking stocks surged on hopes that the `2.11 lakh cr recapitalization plan,
Hang Seng
(0.1)
(40)
28,263
expected to be cash neutral exercise for the government, will improve their lending
Shanghai Com
0.2
8
3,405
capacity and help address their weak capitalization levels. The benchmark BSE
Sensex jumped 1.33 % to 33,043, while the broader Nifty index climbed 0.86 % to
finish at 10,295.
Advances / Declines
BSE
NSE
Advances
1,160
720
News Analysis
Declines
1,560
1,000
RIL, BP finalise plans to develop all KG-D6 fields
Unchanged
131
73
Detailed analysis on Pg2
Volumes (` Cr)
Investor’s Ready Reckoner
BSE
6,014
Key Domestic & Global Indicators
NSE
55,954
Stock Watch: Latest investment recommendations on 150+ stocks
Refer Pg5 onwards
Net Inflows (` Cr)
Net
Mtd
Ytd
Top Picks
FII
(1,191)
(6,463)
30,066
CMP
Target
Upside
Company
Sector
Rating
(`)
(`)
(%)
MFs
691
8,851
95,195
Blue Star
Capital Goods Accumulate
782
867
10.9
Dewan Housing Finance
Financials
Buy
578
670
16.0
Top Gainers
Price (`)
Chg (%)
Asian Granito
Other
Buy
491
570
16.1
Pnb
202
46.2
Navkar Corporation
Other
Buy
198
265
34.2
Canbk
438
38.1
KEI Industries
Capital Goods
Buy
329
380
15.5
More Top Picks on Pg4
Unionbank
176
34.1
Bankindia
188
34.0
Key Upcoming Events
Previous
Consensus
Bankbaroda
188
31.5
Date
Region
Event Description
Reading
Expectations
Oct 26
Euro Zone ECB announces interest rates
-
-
Top Losers
Price (`)
Chg (%)
Oct 26
US
Initial Jobless claims
222.00
235.00
Edelweiss
264
(8.3)
Oct 27
US
GDP Qoq (Annualised)
3.10
2.50
Oct 30
US
Consumer Confidence
119.80
120.75
Cholafin
1,094
(7.2)
Oct 31
Euro Zone Euro-Zone Consumer Confidence
(1.00)
L&Tfh
196
(7.0)
More Events on Pg7
Canfinhome
504
(6.4)
Yesbank
328
(5.9)
As on October, 25 2017
Market Outlook
October 26, 2017
News Analysis
RIL, BP finalise plans to develop all KG-D6 fields
Reliance Industries and BP Plc have finalised plans to develop all the gas fields in
the KG-D6 Block, reflecting the company’s renewed enthusiasm about the policy
and pricing regime and focus on the sector after completing heavy capital
expenditure in its telecoms and petrochemicals businesses. The partners have
submitted the formal Field Development Plan for MJ Field in the gasrich block Cto
the oil ministry on Wednesday, according to sources.
The MJ field, in the deep-sea region of the Bay of Bengal, is located 2,000 metres
below the producing D1and D3 fields, and has reserves of about 1.1 trillion cubic
feet along with condensate.
The KG-D6 Block, which has some of India’s biggest gas discoveries had begun
promisingly and helped India’s gas out- put grow rapidly, but production started
declining and the company was mired in bitter disputes with the government over
various issues, which led to several arbitration cases
Economic and Political News
IGST relief likely for foreign banks, MNCs
Bad loans and stressed assets in banks estimated at $153.5 billion
Recapitalisation will restore the health of banking system, says RBI chief
Corporate News
RBI asks HDFC Bank to classify one of its accounts as NPA
Bank of India and Canara Bank clarified that they are yet to take a decision
on the sale of any non-core assets
Navkar Corp QIP opens at a floor price of `192.29 per share
GlaxoSmithKline Pharma Q2 net up 32% at `130 cr
Market Outlook
October 26, 2017
Quarterly Bloomberg Brokers Consensus Estimate
Yes Bank - Oct 26, 2017
Particulars ( `cr)
2QFY18E
2QFY17
y-o-y (%)
1QFY18
q-o-q (%)
PAT
1,035
802
29.1
965
7.3
Cummins India Ltd - Oct 26, 2017
Particulars ( ` cr)
2QFY18E
2QFY17
y-o-y (%)
1QFY18
q-o-q (%)
Sales
1,370
1,278
7.2
1,340
2.2
EBIDTA
206
198
4.1
195
5.7
%
15.1
15.6
14.6
PAT
196
197
(0.5)
222
(11.7)
Crompton greaves Ltd - Oct 26, 2017
Particulars ( ` cr)
2QFY18E
2QFY17
y-o-y (%)
1QFY18
q-o-q (%)
Sales
1,086
890
22.1
1,055
2.9
EBIDTA
122
97
25.8
130
(6.2)
%
11.2
10.9
12.3
PAT
79
55
43.6
80
(1.3)
ICICI Bank - Oct 27, 2017
Particulars ( `cr)
2QFY18E
2QFY17
y-o-y (%)
1QFY18
q-o-q (%)
PAT
2,570
3,102
(17.2)
2,049
25.4
Canara Bank - Oct 27, 2017
Particulars ( `cr)
2QFY18E
2QFY17
y-o-y (%)
1QFY18
q-o-q (%)
PAT
372
357
4.2
252
47.7
Market Outlook
October 26, 2017
Top Picks ★★★★★
Market Cap
CMP
Target
Upside
Company
Rationale
(` Cr)
(`)
(`)
(%)
Strong growth in domestic business due to its leade`hip
in acute therapeutic segment. Alkem expects to launch
Alkem Laboratories
22,315
1,866
2,079
11.4
more products in USA, which bodes for its international
business.
We expect the company would report strong profitability
Asian Granito
1,477
491
570
16.1
owing to better product mix, higher B2C sales and
amalgamation synergy.
Favorable outlook for the AC industry to augur well for
Cooling products business which is out pacing the
Blue Star
7,489
782
867
10.9
market growth. EMPPAC division's profitability to
improve once operating environment turns around.
With a focus on the low and medium income (LMI)
consumer segment, the company has increased its
Dewan Housing Finance
18,117
578
670
16.0
presence in tier-II & III cities where the growth
opportunity is immense.
Loan growth is likely to pick up after a sluggish FY17.
Lower credit cost will help in strong bottom-line growth.
Karur Vysya Bank
7,563
125
180
43.8
Increasing share of CASA will help in NIM
improvement.
High order book execution in EPC segment, rising B2C
KEI Industries
2,560
329
380
15.5
sales and higher exports to boost the revenues and
profitability
Expected to benefit from the lower capex requirement
Music Broadcast
2,179
382
434
13.6
and 15 year long radio broadcast licensing.
Massive capacity expansion along with rail advantage
Navkar Corporation
2,817
198
265
34.2
at ICD as well CFS augur well for the company
Strong brands and distribution network would boost
Siyaram Silk Mills
2,697
575
610
6.01
growth going ahead. Stock currently trades at an
inexpensive valuation.
Market leadership in Hindi news genre and no.
2
viewership ranking in English news genre, exit from the
TV Today Network
2,090
350
435
24.1
radio business, and anticipated growth in ad spends by
corporate to benefit the stock.
After GST, the company is expected to see higher
volumes along with improving product mix. The Gujarat
Maruti Suzuki
2,37,791
7,872
8,658
10.0
plant will also enable higher operating leverage which
will be margin accretive.
We expect loan book to grow at 24.3% over next two
GIC Housing
2,631
489
655
34.0
year; change in borrowing mix will help in NIM
improvement..
Source: Company, Angel Research
Market Outlook
October 26, 2017
Key Upcoming Events
Result Calendar
D ate
C ompany
October 26, 2017
Cummins Indi a, Yes Bank, Vijaya Bank, Mphasis
October 27, 2017
Maruti, J & K Bank, ICICI Bank, Canara Bank, ITC, P VR, IOC, Styrolution
Source: Bloomberg, Angel Research
Global economic events release calendar
Bl oomberg Data
D ate
Time
C ountry
Event Description
Unit
Period
L ast Reporte d
E stimate d
Oct 26, 2017
5:15 PMEuro Zone ECB announces interest rates
%
Oct 26
-
-
6:00 PMUS
Initial Jobless claims
Thousands
Oct 21
222.00
235.00
Oct 27, 2017
6:00 PMUS
GDP Qoq (Annualise d)
% Change
3Q A
3.10
2.50
Oct 30, 2017
7:30 PMUS
Consumer Confidence
S.A./ 1985=100
Oct
119.80
120.75
Oct 31, 2017
3:30 PMEuro Zone Euro-Zone Consumer Confidence
Value
Oct F
(1.00)
6:30 AMChina
PMI Manufacturing
Value
Oct
52.40
52.20
3:30 PMEuro Zone Euro-Zone GDP s.a. (QoQ)
% Change
3Q A
0.70
Nov 01, 2017
3:00 PMUK
PMI Manufacturing
Value
Oct
55.90
11: 30 PMUS
FOMC rate decision
%
Nov 1
1.25
1.25
Nov 02, 2017
2:25 PMGermany PMI Manufacturing
Value
Oct F
60.50
2:25 PMGermany Unempl oyment change (000's)
Thousands
Oct
(22.00)
5:30 PMUK
BOE Announce s rate s
% Ratio
Nov 2
0.25
0.50
Nov 03, 2017
6:00 PMUS
Change in N onfarm payrolls
Thousands
Oct
(33.00)
308.00
6:00 PMUS
Unnemployment rate
%
Oct
4.20
4.20
Nov 06, 2017
2:25 PMGermany PMI Services
Value
Oct F
55.20
Source: Bloomberg, Angel Research
Market Outlook
October 26, 2017
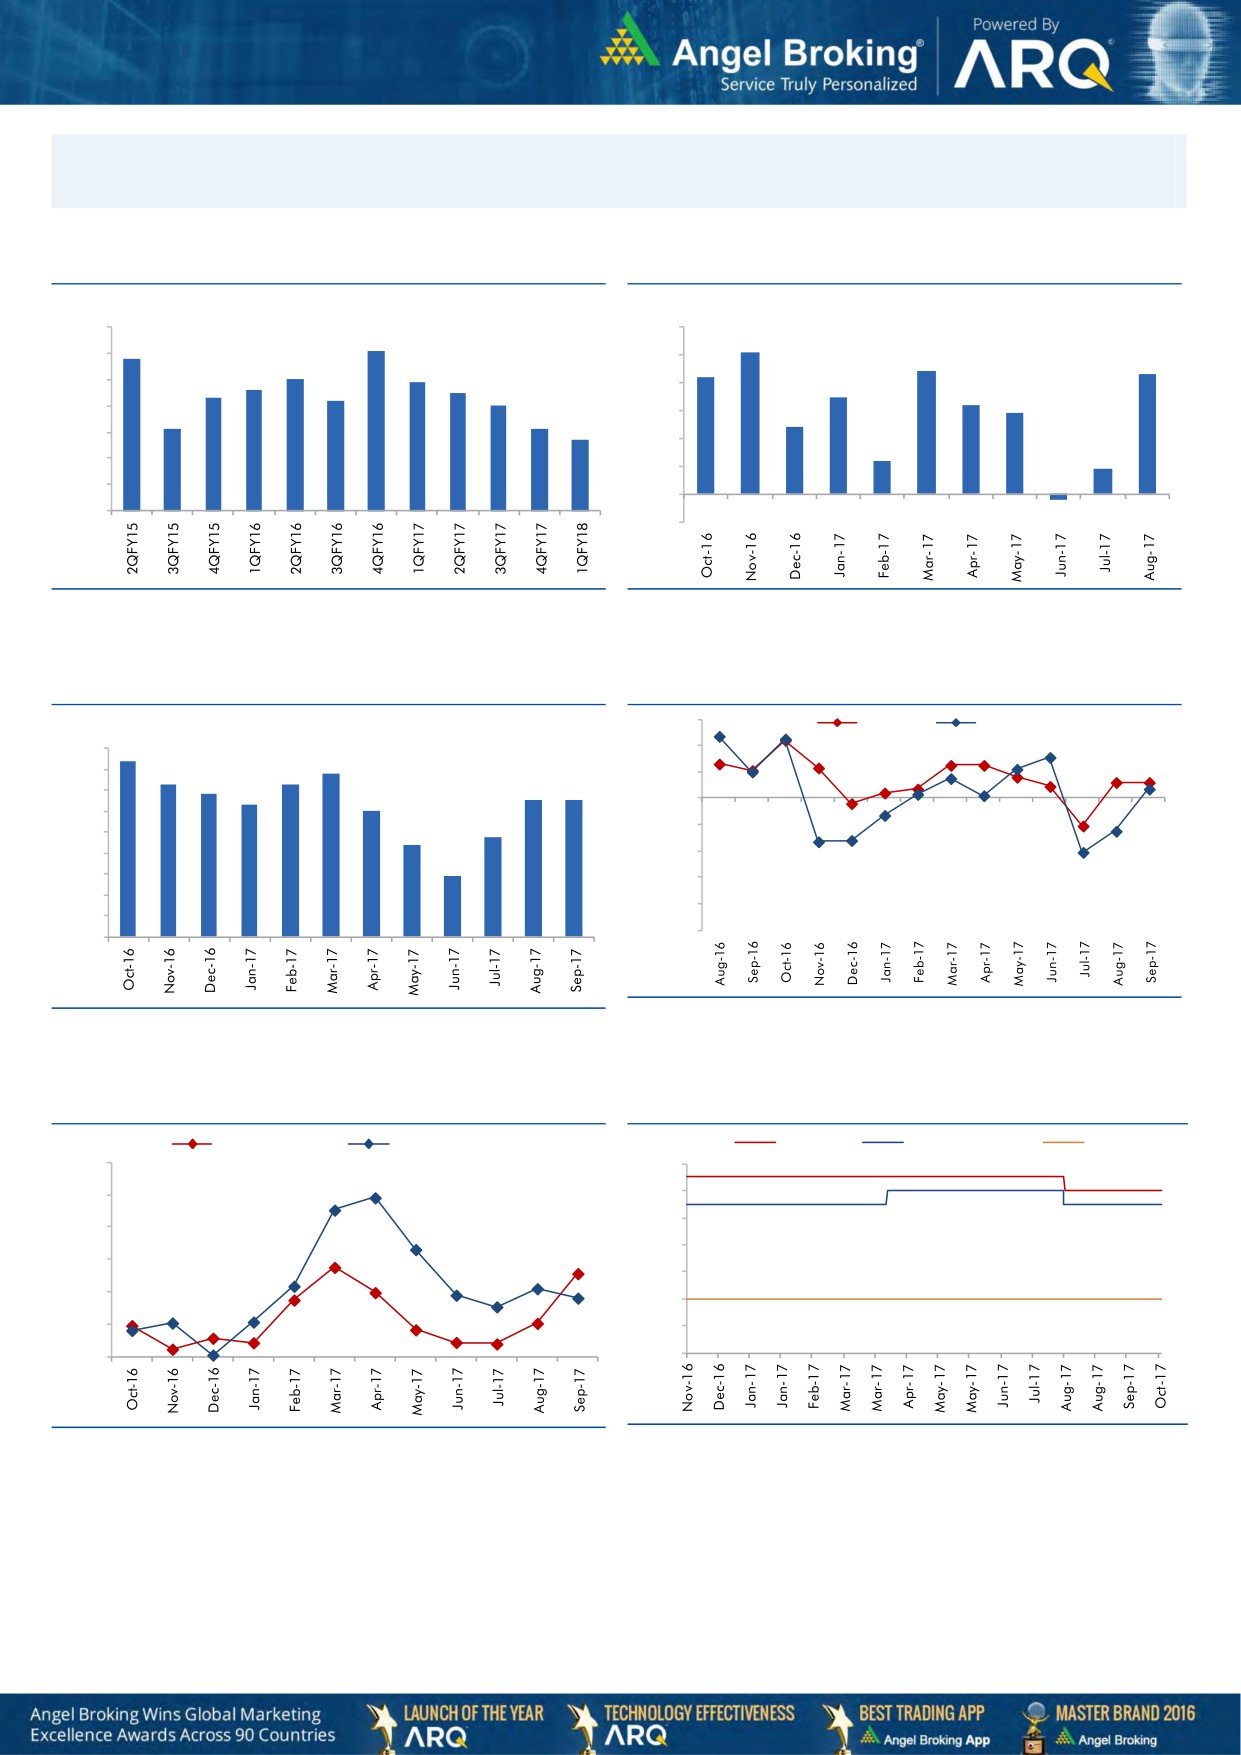
Macro watch
Exhibit 1: Quarterly GDP trends
Exhibit 2: IIP trends
(%)
(%)
10.0
6.0
9.1
5.1
8.8
9.0
5.0
4.4
4.3
8.0
7.9
4.2
7.6
7.5
8.0
7.3
7.2
4.0
3.5
7.0
3.2
2.9
7.0
6.1
6.1
3.0
2.4
5.7
6.0
2.0
1.2
0.9
5.0
1.0
4.0
-
3.0
(1.0)
(0.2)
Source: CSO, Angel Research
Source: MOSPI, Angel Research
Exhibit 3: Monthly CPI inflation trends
Exhibit 4: Manufacturing and services PMI
56.0
Mfg. PMI
Services PMI
(%)
4.5
4.2
54.0
3.9
4.0
3.6
3.7
52.0
3.4
3.3
3.3
3.5
3.2
3.0
50.0
3.0
2.2
2.4
48.0
2.5
2.0
46.0
1.5
1.5
44.0
1.0
42.0
0.5
40.0
-
Source: Market, Angel Research; Note: Level above 50 indicates expansion
Source: MOSPI, Angel Research
Exhibit 5: Exports and imports growth trends
Exhibit 6: Key policy rates
(%)
Exports yoy growth
Imports yoy growth
(%)
Repo rate
Reverse Repo rate
CRR
60.0
6.50
50.0
6.00
5.50
40.0
5.00
30.0
4.50
20.0
4.00
10.0
3.50
0.0
3.00
Source: Bloomberg, Angel Research
Source: RBI, Angel Research
Market Outlook
October 26, 2017
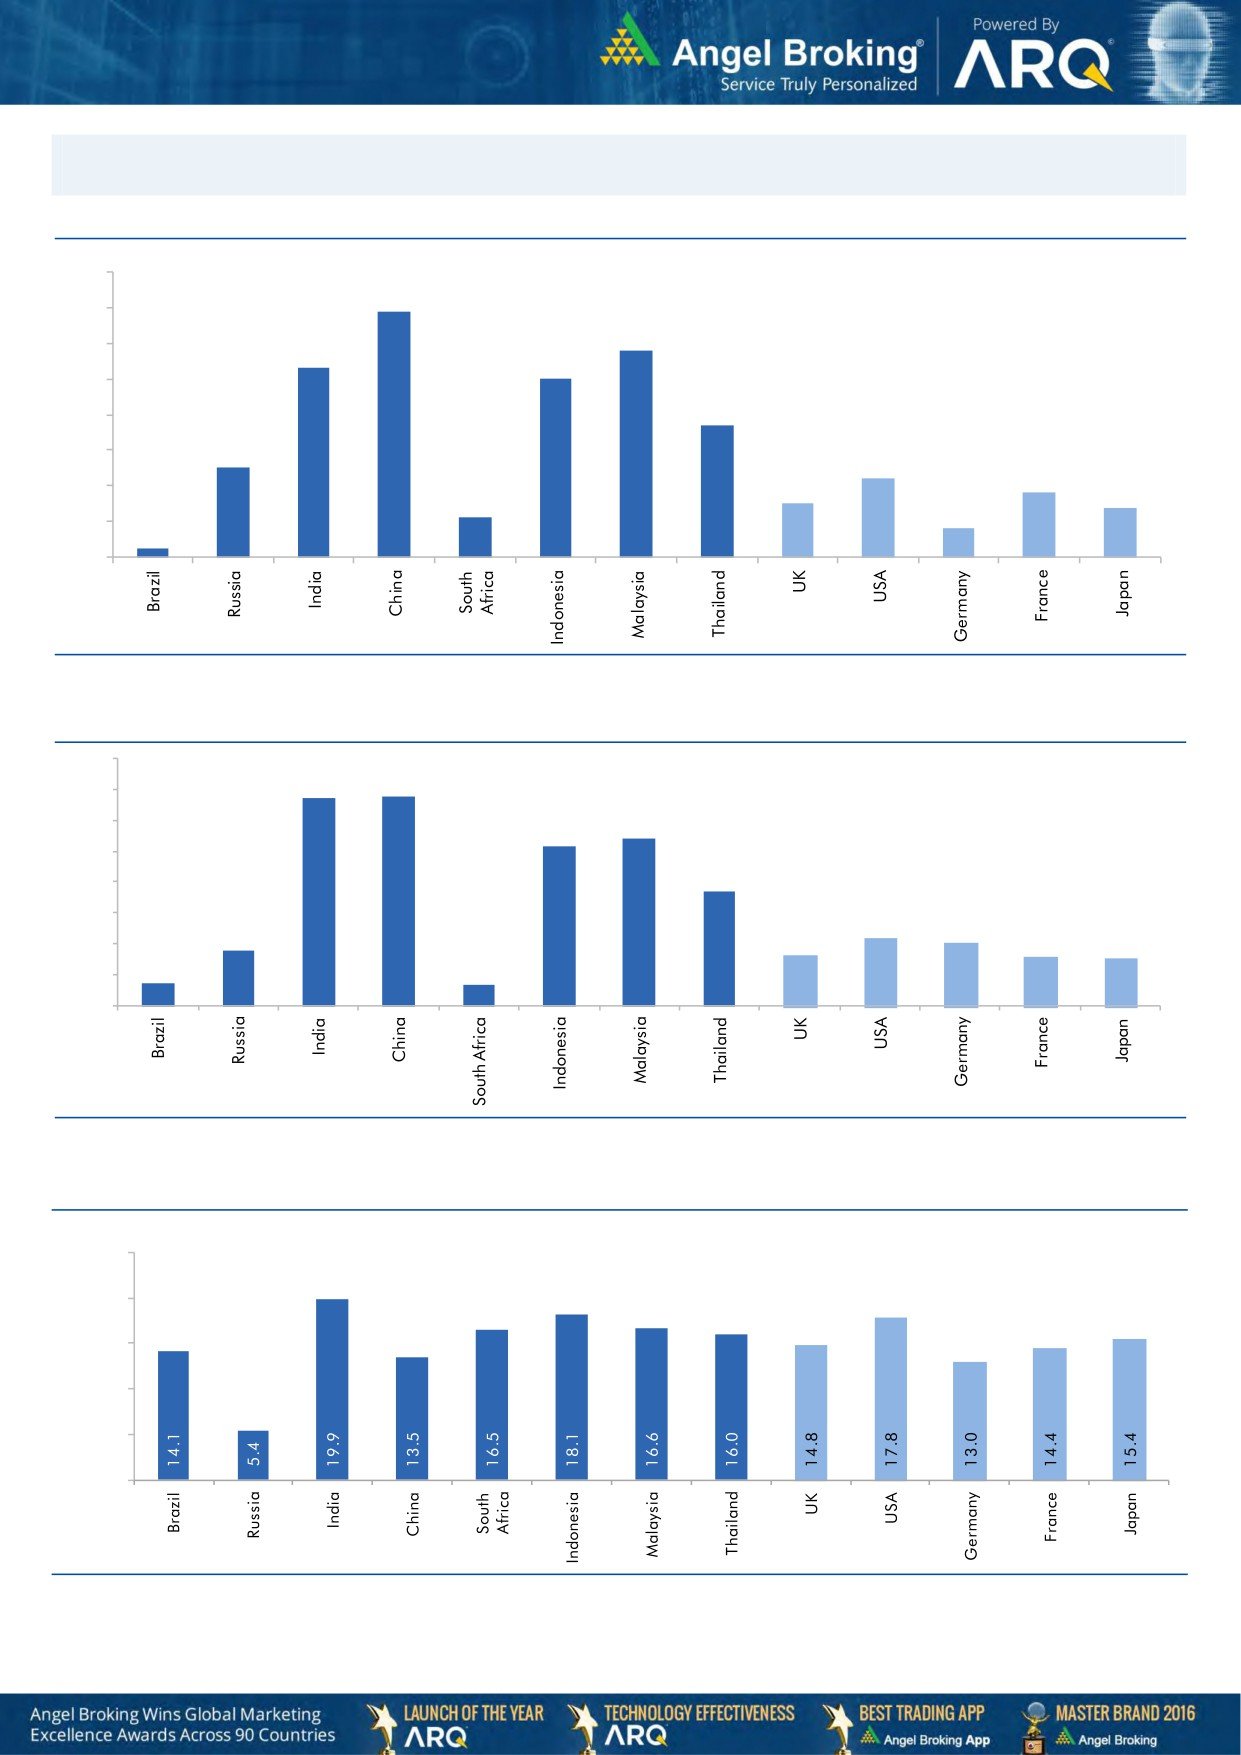
Global watch
Exhibit 1: Latest quarterly GDP Growth (%, yoy) across select developing and developed countries
(%)
8.0
6.9
7.0
5.8
6.0
5.3
5.0
5.0
1.1
3.7
4.0
2.5
3.0
2.2
1.8
2.0
1.5
1.4
0.8
1.0
0.3
-
Source: Bloomberg, Angel Research
Exhibit 2: 2017 GDP Growth projection by IMF (%, yoy) across select developing and developed countries
(%)
6.7
6.8
7.0
6.0
5.4
5.2
5.0
3.7
4.0
3.0
1.8
2.2
2.0
1.7
1.6
2.0
0.7
1.5
0.7
1.0
-
Source: IMF, Angel Research
Exhibit 3: One year forward P-E ratio across select developing and developed countries
(x)
25.0
20.0
15.0
10.0
5.0
-
Source: IMF, Angel Research as on 25 Oct 2017
Market Outlook
October 26, 2017
Exhibit 4: Relative performance of indices across globe
Returns (%)
C ountry
Name of index
Closing price
1M
3M
1YR
Brazil
Bovespa
76,671
1.7
16.8
19.6
Russia
Micex
2,049
(0.9)
5.4
3.5
India
Nifty
10,295
1.7
3.8
18.4
China
Shanghai Composite
3,397
1.4
5.2
10.4
South Africa
Top 40
51,858
4.6
7.5
15.1
Mexico
Mexbol
48,876
(3.0)
(4.6)
1.6
Indonesia
LQ45
996
2.3
2.2
8.0
Malaysia
KLCI
1,739
(1.8)
(0.9)
5.2
Thailand
SET 50
1,086
1.5
8.8
15.6
USA
Dow Jones
23,329
4.6
7.5
28.2
UK
FTSE
7,447
2.0
(0.1)
6.6
Japan
Nikkei
21,708
7.0
8.7
27.7
Germany
DAX
12,953
2.9
5.3
21.5
France
CAC
5,375
2.0
3.6
21.8
Source: Bloomberg, Angel Research as on 25 Oct 2017 p68in4
Stock Watch
October 26, 2017
Company Name
Reco
CMP
Target
Mkt Cap
Sales ( Čcr )
OPM(%)
EPS (Č)
PER(x)
P/BV(x)
RoE(%)
EV/Sales(x)
(Č)
Price ( Č)
( Č cr )
FY18E FY19E
FY18E
FY19E
FY18E
FY19E
FY18E
FY19E
FY18E
FY19E
FY18E
FY19E
FY18E
FY19E
Agri / Agri Chemical
Rallis
Reduce
238
209
4,627
1,873
2,099
15.0
15.0
9.5
10.5
25.1
22.7
3.8
3.4
15.8
16.0
2.4
2.1
United Phosphorus
Neutral
799
-
40,574
18,922
21,949
18.0
18.5
36.2
45.6
22.1
17.5
4.6
3.8
22.7
23.8
2.3
1.9
Auto & Auto Ancillary
Ashok Leyland
Neutral
129
-
37,621
23,339
27,240
10.1
10.8
4.7
6.2
27.7
20.7
5.5
4.9
20.0
23.6
1.6
1.3
Bajaj Auto
Neutral
3,234
-
93,567
23,936
27,955
19.5
20.1
142.7
167.3
22.7
19.3
4.9
4.4
21.8
22.8
3.5
2.9
Bharat Forge
Buy
657
875
30,571
7,637
8,755
21.7
23.2
36.1
47.3
18.2
13.9
3.3
2.8
18.5
20.8
3.9
3.3
Eicher Motors
Neutral
31,716
-
86,340
19,043
22,837
19.5
19.9
835.4
1,019.0
38.0
31.1
14.2
10.9
40.9
37.8
4.4
3.6
Gabriel India
Neutral
197
-
2,832
1,782
2,033
9.7
10.2
7.1
8.9
27.8
22.3
5.6
4.7
21.0
22.2
1.5
1.3
Hero Motocorp
Accumulate
3,769
4,129
75,272
32,239
36,878
16.0
15.6
184.4
206.5
20.4
18.3
6.4
5.6
31.3
30.7
2.1
1.8
Jamna Auto Industries Neutral
61
-
2,415
1,441
1,662
14.4
14.8
13.9
17.6
4.4
3.4
1.2
1.0
30.0
31.0
1.7
1.4
Mahindra and Mahindra Neutral
1,364
-
84,742
46,971
53,816
13.6
14.0
67.7
79.8
20.2
17.1
2.9
2.6
15.0
15.9
1.7
1.4
Maruti
Accumulate
7,872
8,658
237,791
81,825
101,245
15.0
15.0
283.5
356.0
27.8
22.1
6.1
4.9
21.9
22.4
2.6
2.0
Minda Industries
Neutral
812
-
7,016
4,328
5,084
11.0
11.9
27.3
36.4
29.8
22.3
6.3
4.9
23.1
25.6
1.7
1.4
Motherson Sumi
Neutral
359
-
75,523
55,937
64,445
10.8
11.4
16.9
21.1
21.2
17.0
4.8
4.9
25.2
25.4
1.4
1.2
Tata Motors
Neutral
422
-
121,846
303,167
343,649
11.8
13.8
33.1
54.7
12.8
7.7
2.1
1.7
16.9
23.0
0.5
0.4
TVS Motor
Neutral
693
-
32,943
13,992
16,216
9.0
9.4
17.1
20.3
40.7
34.2
10.8
8.4
29.7
27.7
2.3
1.9
Amara Raja Batteries
Buy
704
858
12,028
6,140
7,122
14.3
15.6
29.3
39.0
24.0
18.1
4.1
3.4
17.1
19.0
2.0
1.7
Exide Industries
Neutral
209
-
17,765
8,689
9,854
15.1
15.2
9.7
11.0
21.7
19.0
3.8
3.4
15.7
16.1
1.8
1.5
Apollo Tyres
Neutral
241
-
12,280
15,739
17,326
13.3
14.6
20.4
26.7
11.8
9.0
1.4
1.3
20.4
26.7
1.0
0.9
Ceat
Neutral
1,671
-
6,759
6,661
7,717
11.1
14.2
116.2
178.2
14.4
9.4
2.5
2.1
15.2
21.3
1.1
1.0
JK Tyres
Neutral
146
-
3,308
8,318
9,239
16.2
16.4
21.0
27.5
7.0
5.3
1.4
1.1
19.1
20.4
0.8
0.7
Swaraj Engines
Neutral
2,007
-
2,493
788
889
16.4
16.5
71.6
81.0
28.0
24.8
8.1
7.5
29.6
31.0
2.8
2.4
Subros
Neutral
251
-
1,503
1,855
2,135
11.6
11.8
10.3
14.7
24.5
17.1
3.7
3.2
15.8
19.1
1.0
0.9
Capital Goods
BEML
Neutral
1,747
-
7,274
4,286
5,194
7.1
8.2
42.9
58.1
40.7
30.1
3.3
3.0
7.6
8.7
1.8
1.4
Bharat Electronics
Neutral
171
-
42,113
10,258
12,470
19.6
19.5
7.3
8.6
23.5
19.9
0.5
0.4
20.4
21.9
3.6
2.9
Voltas
Neutral
535
-
17,702
6,778
8,004
9.6
11.0
17.1
22.4
31.3
23.9
7.5
6.5
17.7
19.8
2.3
1.9
BHEL
Neutral
91
-
33,263
33,200
39,167
6.8
9.5
6.2
11.2
14.6
8.1
0.7
0.6
4.6
8.0
0.6
0.4
Blue Star
Accumulate
782
867
7,489
5,220
6,207
6.3
6.6
16.8
22.3
46.5
35.1
9.2
8.2
19.9
23.3
1.4
1.2
CG Power and Industrial
Neutral
81
-
5,080
6,555
7,292
7.5
7.5
-
0.8
8,105.0
101.3
1.3
1.3
0.1
1.2
0.9
0.8
Solutions
Greaves Cotton
Neutral
129
-
3,145
1,778
1,993
14.7
15.1
8.1
9.1
15.9
14.2
3.6
3.3
21.8
23.6
1.5
1.4
Stock Watch
October 26, 2017
Company Name
Reco
CMP
Target
Mkt Cap
Sales ( Čcr )
OPM(%)
EPS (Č)
PER(x)
P/BV(x)
RoE(%)
EV/Sales(x)
(Č)
Price ( Č)
( Č cr )
FY18E FY19E
FY18E
FY19E
FY18E
FY19E
FY18E
FY19E
FY18E
FY19E
FY18E
FY19E
FY18E
FY19E
Capital Goods
KEC International
Buy
287
350
7,385
9,779
11,113
9.4
9.8
14.2
18.2
20.2
15.8
3.9
3.2
21.1
22.1
1.0
0.9
KEI Industries
Buy
329
380
2,560
3,001
3,391
10.0
10.0
13.0
16.1
25.3
20.4
4.6
3.8
18.2
18.7
1.0
0.9
Thermax
Neutral
985
-
11,733
4,125
4,747
10.3
10.8
26.7
31.5
36.9
31.3
4.1
3.8
11.2
12.0
2.6
2.2
VATech Wabag
Buy
590
681
3,221
3,867
4,126
9.6
10.0
34.9
39.8
16.9
14.8
2.8
2.4
17.7
17.5
0.9
0.8
Cement
ACC
Neutral
1,804
-
33,871
12,255
13,350
13.5
14.3
58.0
66.2
31.1
27.3
3.7
3.4
11.5
12.2
2.7
2.5
Ambuja Cements
Neutral
282
-
55,916
10,250
11,450
17.5
19.0
7.2
8.3
39.1
33.9
2.8
2.6
7.0
7.8
5.2
4.6
India Cements
Neutral
190
-
5,852
6,135
6,750
14.8
15.2
8.5
11.5
22.3
16.5
1.1
1.1
4.8
6.2
1.3
1.1
JK Cement
Neutral
982
-
6,862
4,150
4,775
19.2
20.0
49.0
63.5
20.0
15.5
3.2
2.7
17.0
18.5
2.1
1.8
J K Lakshmi Cement
Neutral
431
-
5,072
3,422
3,757
15.5
17.0
13.5
23.2
31.9
18.6
3.3
2.9
10.8
15.5
1.9
1.6
Orient Cement
Neutral
162
-
3,320
2,215
3,233
16.8
17.0
5.9
6.9
27.5
23.5
2.1
1.9
10.8
10.1
2.5
1.7
UltraTech Cement
Neutral
4,465
-
122,571
28,250
35,150
20.2
23.5
77.5
122.2
57.6
36.5
4.9
4.4
9.6
14.8
4.8
3.8
Construction
KNR Constructions
Neutral
243
-
3,416
1,846
2,203
14.5
14.5
12.1
13.7
20.1
17.8
1.1
1.0
17.5
16.7
1.9
1.6
Larsen & Toubro
Neutral
1,204
-
168,689
95,787
109,476
10.2
11.6
44.5
50.8
27.1
23.7
3.4
3.1
12.9
13.1
2.3
2.0
Gujarat Pipavav Port
Neutral
140
-
6,790
739
842
61.6
62.7
5.1
6.2
27.5
22.8
3.4
3.4
12.7
14.9
8.6
7.5
PNC Infratech
Neutral
176
-
4,520
2,040
2,935
13.0
13.0
6.4
9.0
27.5
19.6
0.7
0.6
9.7
12.2
2.2
1.6
Simplex Infra
Neutral
504
-
2,493
6,012
6,619
11.6
11.7
21.1
31.0
23.9
16.3
1.7
1.5
6.5
8.6
0.9
0.9
Sadbhav Engineering
Neutral
316
-
5,428
3,823
4,426
10.7
10.8
10.3
11.8
30.7
26.8
3.7
3.2
10.1
10.5
1.7
1.5
NBCC
Neutral
246
-
22,181
9,099
12,706
6.4
6.4
7.3
9.6
33.9
25.8
1.5
1.2
27.5
30.5
2.3
1.7
MEP Infra
Neutral
98
-
1,591
2,403
2,910
18.3
16.8
2.4
6.1
41.6
16.1
15.8
10.6
35.2
55.8
1.8
1.5
SIPL
Neutral
107
-
3,772
2,060
2,390
46.8
47.7
(5.8)
(3.1)
4.0
4.6
(14.2)
(2.3)
6.6
6.2
Engineers India
Neutral
158
-
10,647
1,795
2,611
21.1
22.4
5.9
8.1
26.8
19.5
1.9
1.9
12.9
16.1
4.3
2.8
Financials
Axis Bank
Buy
473
580
113,334
32,558
35,843
3.5
3.2
27.8
41.0
17.0
11.5
1.8
1.6
11.4
14.9
-
-
Bank of Baroda
Neutral
188
-
43,364
22,533
26,079
2.4
2.4
12.0
20.9
15.7
9.0
1.0
1.0
6.6
11.0
-
-
Canara Bank
Neutral
438
-
26,155
17,925
20,235
2.0
2.1
18.5
36.5
23.7
12.0
0.9
0.8
3.4
6.2
-
-
Can Fin Homes
Buy
503
2,128
6,696
586
741
3.5
3.5
107.8
141.0
4.7
3.6
1.0
0.8
24.1
25.6
-
-
Cholamandalam Inv. &
Accumulate
1,093
1,230
17,087
2,826
3,307
6.3
6.3
53.7
64.6
20.4
16.9
3.5
3.0
18.3
18.9
-
-
Fin. Co.
Dewan Housing Finance Buy
578
670
18,117
2,676
3,383
2.4
2.7
37.4
49.7
15.5
11.6
2.0
1.8
13.8
16.2
-
-
Equitas Holdings
Buy
151
235
5,107
1,125
1,380
9.6
9.8
1.5
6.0
100.5
25.1
2.3
2.1
2.4
8.2
-
-
Federal Bank
Neutral
121
-
23,591
4,896
5,930
2.8
3.1
5.4
7.6
22.6
16.0
1.9
1.8
8.5
11.0
-
-
Stock Watch
October 26, 2017
Company Name
Reco
CMP
Target
Mkt Cap
Sales ( Čcr )
OPM(%)
EPS (Č)
PER(x)
P/BV(x)
RoE(%)
EV/Sales(x)
(Č)
Price ( Č)
( Č cr )
FY18E FY19E
FY18E
FY19E
FY18E
FY19E
FY18E
FY19E
FY18E
FY19E
FY18E
FY19E
FY18E
FY19E
Financials
GIC Housing
Buy
489
655
2,631
376
477
3.6
3.7
33.0
40.0
14.8
12.2
2.7
2.2
20.0
23.0
-
-
HDFC Bank
Neutral
1,795
-
463,231
55,236
63,253
4.5
4.4
68.9
82.4
26.1
21.8
4.5
3.8
18.7
18.5
-
-
ICICI Bank
Neutral
306
-
196,077
42,361
51,378
3.6
3.9
18.4
25.7
16.6
11.9
1.8
1.8
11.3
15.0
-
-
Karur Vysya Bank
Buy
125
180
7,563
3,289
3,630
3.7
3.9
10.8
14.1
11.6
8.9
1.4
1.2
12.5
14.7
-
-
LIC Housing Finance
Neutral
618
-
31,186
4,895
6,332
3.4
3.7
50.7
66.8
12.2
9.3
2.4
2.0
21.7
23.8
-
-
Punjab Natl.Bank
Neutral
202
-
42,964
23,708
25,758
2.1
2.1
5.9
16.4
34.4
12.3
1.0
1.0
3.0
8.3
-
-
RBL Bank
Neutral
524
-
21,665
2,309
2,888
2.6
2.5
16.4
19.1
32.1
27.5
4.0
3.6
13.3
13.8
-
-
Repco Home Finance
Buy
616
825
3,855
496
597
4.4
4.2
38.5
48.7
16.0
12.6
2.9
2.4
19.6
20.6
-
-
South Ind.Bank
Neutral
31
-
5,585
3,195
3,567
3.0
3.1
3.0
3.8
10.3
8.1
1.0
0.9
10.5
11.9
-
-
St Bk of India
Neutral
325
-
280,283
105,827
121,056
2.4
2.5
16.1
25.6
20.2
12.7
1.6
1.4
6.6
9.9
-
-
Union Bank
Neutral
176
-
12,792
14,650
16,225
2.3
2.3
23.1
32.5
7.6
5.4
0.6
0.5
7.1
9.2
-
-
Yes Bank
Neutral
328
-
75,036
11,088
13,138
3.0
2.9
84.0
99.3
3.9
3.3
0.6
0.5
16.3
16.8
-
-
FMCG
Akzo Nobel India
Neutral
1,853
-
8,886
3,164
3,607
13.8
13.7
58.6
67.9
31.6
27.3
7.8
6.8
24.5
25.1
2.7
2.3
Asian Paints
Neutral
1,203
-
115,353
17,603
20,615
18.6
18.6
2,128.9
2,543.3
0.6
0.5
11.9
10.0
28.0
28.9
6.4
5.4
Britannia
Neutral
4,635
-
55,649
9,690
11,278
14.8
15.4
84.0
101.0
55.2
45.9
20.1
16.0
40.6
39.0
5.7
4.9
Colgate
Neutral
1,038
-
28,240
4,420
5,074
24.9
25.3
28.6
32.8
36.3
31.7
14.3
11.6
43.8
40.5
6.1
5.3
Dabur India
Neutral
323
-
56,827
8,346
9,344
19.6
19.9
7.8
9.0
41.4
35.8
8.3
7.5
25.2
24.8
6.4
5.6
GlaxoSmith Con*
Neutral
4,924
-
20,708
5,072
5,760
18.2
18.4
176.3
199.2
27.9
24.7
5.9
5.4
21.2
21.7
3.4
2.9
Godrej Consumer
Neutral
922
-
62,849
10,171
11,682
20.8
21.5
21.7
27.1
42.5
34.0
9.6
8.2
22.3
23.4
6.3
5.4
HUL
Neutral
1,274
-
275,657
37,077
41,508
20.3
21.8
5,189.9
6,318.5
0.3
0.2
38.8
33.2
74.8
82.0
7.3
6.5
ITC
Neutral
269
-
328,077
44,588
49,853
37.0
37.3
9.6
11.0
28.1
24.5
6.9
6.6
25.1
27.3
6.8
6.1
Marico
Neutral
315
-
40,650
6,788
7,766
18.5
19.2
7.1
8.5
44.4
37.1
15.5
13.3
36.9
38.0
5.8
5.1
Nestle*
Neutral
7,153
-
68,969
10,083
11,182
20.0
20.9
119.7
141.3
59.8
50.6
210.6
192.5
36.7
39.8
6.5
5.8
Tata Global
Neutral
205
-
12,957
7,121
7,641
11.9
12.3
6.9
8.0
29.8
25.7
2.0
1.9
6.8
7.2
1.6
1.5
Procter & Gamble
Neutral
8,647
-
28,067
3,034
3,579
27.1
27.7
167.7
198.8
51.6
43.5
13.8
11.9
28.8
29.5
8.7
7.3
Hygiene
IT
HCL Tech^
Accumulate
907
1,014
129,428
52,342
57,053
20.9
20.9
62.8
67.6
14.4
13.4
3.2
2.8
22.4
20.6
2.1
1.9
Infosys
Buy
935
1,179
214,861
73,963
80,619
26.0
26.0
64.4
69.3
14.5
13.5
2.9
2.6
19.7
19.6
2.3
2.1
TCS
Neutral
2,562
-
504,774
127,403
138,870
27.6
27.6
144.5
156.0
17.7
16.4
5.3
4.9
29.7
29.8
3.6
3.3
Tech Mahindra
Accumulate
468
533
45,692
31,015
33,496
15.0
15.0
35.6
38.1
13.2
12.3
2.2
2.1
17.0
16.3
1.3
1.1
Stock Watch
October 26, 2017
Company Name
Reco
CMP
Target
Mkt Cap
Sales ( Čcr )
OPM(%)
EPS (Č)
PER(x)
P/BV(x)
RoE(%)
EV/Sales(x)
(Č)
Price ( Č)
( Č cr )
FY18E FY19E
FY18E
FY19E
FY18E
FY19E
FY18E
FY19E
FY18E
FY19E
FY18E
FY19E
FY18E
FY19E
IT
Wipro
Neutral
299
-
145,490
58,536
61,858
20.3
20.3
18.2
19.1
16.4
15.7
2.6
2.2
14.6
13.4
2.4
2.3
Media
D B Corp
Neutral
360
-
6,623
2,404
2,625
30.5
31.5
23.7
26.9
15.2
13.4
3.6
3.1
23.5
22.8
2.6
2.4
HT Media
Neutral
102
-
2,375
2,589
2,830
15.1
15.4
8.3
10.9
12.3
9.4
1.0
0.9
8.4
10.4
0.5
0.3
Jagran Prakashan
Buy
177
225
5,770
2,541
2,835
28.5
28.7
12.7
14.1
13.9
12.5
2.9
2.5
21.3
21.4
2.1
1.8
Sun TV Network
Neutral
808
-
31,824
3,238
3,789
51.9
55.1
30.9
38.0
26.1
21.3
7.5
6.5
30.0
31.0
9.3
7.9
Hindustan Media
Neutral
241
-
1,769
1,002
1,074
23.3
23.5
29.2
33.8
8.3
7.1
1.3
1.1
15.6
15.4
0.8
0.5
Ventures
TV Today Network
Buy
350
435
2,090
667
727
27.7
27.7
18.6
20.1
18.8
17.5
2.9
3.0
15.6
17.3
2.7
2.5
Music Broadcast Limited Accumulate
382
434
2,179
271
317
91.0
109.0
6.0
10.0
63.7
38.2
4.0
3.6
6.5
9.3
7.6
6.3
Metals & Mining
Coal India
Neutral
289
-
179,487
82,301
91,235
17.0
18.0
17.1
20.5
16.9
14.1
3.2
3.0
45.0
55.0
1.9
1.7
Hind. Zinc
Neutral
319
-
134,724
22,108
24,555
57.0
58.0
22.1
26.3
14.4
12.1
4.7
3.8
32.0
35.0
5.1
4.3
Hindalco
Neutral
267
-
59,848
102,350
105,355
13.5
14.5
21.5
24.5
12.4
10.9
1.7
1.4
15.0
15.2
1.2
1.1
JSW Steel
Neutral
260
-
62,799
64,500
68,245
21.1
21.5
20.1
21.2
12.9
12.3
2.4
2.0
-
-
1.7
1.6
NMDC
Neutral
121
-
38,315
10,209
11,450
47.0
48.0
11.1
12.1
10.9
10.0
1.5
1.4
-
-
3.3
3.0
SAIL
Neutral
67
-
27,651
54,100
63,555
3.0
10.0
(10.0)
1.5
44.6
0.9
0.9
-
-
1.5
1.3
Vedanta
Neutral
336
-
124,861
81,206
87,345
28.0
29.0
26.5
33.5
12.7
10.0
2.9
2.5
-
-
2.3
2.0
Tata Steel
Neutral
717
-
69,646
121,445
126,500
16.2
17.2
65.4
81.3
11.0
8.8
1.7
1.5
-
-
1.1
1.0
Oil & Gas
GAIL
Neutral
459
-
77,665
53,115
52,344
14.2
15.3
30.0
31.1
15.3
14.8
1.9
1.8
-
-
1.2
1.2
ONGC
Neutral
177
-
226,892
83,111
84,934
44.2
44.9
16.4
16.9
10.8
10.5
1.3
1.2
-
-
2.6
2.6
Indian Oil Corp
Neutral
417
-
202,613
396,116
432,560
8.5
8.8
40.1
42.2
10.4
9.9
1.8
1.6
-
-
0.7
0.6
Reliance Industries
Neutral
940
-
611,325
257,711
267,438
17.0
18.2
89.1
89.5
10.6
10.5
1.0
0.9
-
-
2.0
1.9
Pharmaceuticals
Alembic Pharma
Buy
493
600
9,288
3,903
4,584
18.2
19.2
21.8
27.2
22.6
18.1
4.1
3.4
19.8
20.6
2.4
2.0
Alkem Laboratories Ltd
Accumulate
1,866
2,079
22,315
6,320
7,341
17.5
19.8
72.7
96.6
25.7
19.3
4.5
3.8
16.7
18.7
3.5
2.9
Aurobindo Pharma
Accumulate
735
823
43,077
17,086
19,478
22.1
22.0
44.7
51.4
16.5
14.3
3.6
2.9
24.7
22.7
2.6
2.3
Aventis*
Neutral
4,200
-
9,673
2,508
2,862
16.8
16.8
139.9
153.8
30.0
27.3
4.4
3.5
23.5
25.8
3.5
2.9
Cadila Healthcare
Reduce
481
426
49,211
11,584
13,228
20.3
20.4
18.7
21.3
25.7
22.6
5.7
4.7
24.6
22.9
4.1
3.5
Cipla
Sell
594
458
47,762
16,619
19,437
15.4
16.2
19.7
24.3
30.1
24.4
3.4
3.0
12.0
13.2
3.0
2.6
Dr Reddy's
Neutral
2,352
-
38,993
15,844
17,973
17.6
18.2
91.7
111.0
25.7
21.2
2.9
2.6
11.9
13.0
2.7
2.4
GSK Pharma*
Neutral
2,423
-
20,522
3,260
3,651
15.0
18.0
46.1
58.6
52.6
41.3
10.8
11.1
20.0
26.5
6.2
5.6
Indoco Remedies
Sell
274
153
2,523
1,154
1,310
14.9
14.9
11.3
12.7
24.2
21.6
3.4
3.0
15.0
15.0
2.3
2.0
Stock Watch
October 26, 2017
Company Name
Reco
CMP
Target
Mkt Cap
Sales ( Čcr )
OPM(%)
EPS (Č)
PER(x)
P/BV(x)
RoE(%)
EV/Sales(x)
(Č)
Price ( Č)
( Č cr )
FY18E FY19E
FY18E
FY19E
FY18E
FY19E
FY18E
FY19E
FY18E
FY19E
FY18E
FY19E
FY18E
FY19E
Pharmaceuticals
Ipca labs
Accumulate
502
540
6,331
3,593
4,022
14.5
15.5
19.4
25.2
25.9
19.9
2.4
2.1
9.5
11.2
1.8
1.6
Lupin
Buy
1,004
1,467
45,349
18,657
21,289
21.3
23.3
52.8
66.7
19.0
15.1
2.9
2.4
16.3
17.5
2.4
2.0
Natco Pharma
Accumulate
977
1,057
17,030
1,886
2,016
32.3
29.5
23.2
22.0
42.2
44.3
8.8
7.8
20.9
17.6
8.9
8.3
Sun Pharma
Accumulate
523
558
125,541
32,899
36,451
26.9
25.4
31.6
32.3
16.6
16.2
2.9
2.5
18.7
18.8
3.4
3.0
Syngene International
Accumulate
507
557
10,138
1,402
1,823
32.8
36.0
15.9
20.7
31.9
24.5
6.0
4.9
18.7
20.0
7.2
5.5
Power
Tata Power
Neutral
82
-
22,247
32,547
33,806
20.5
20.5
4.7
5.4
17.5
15.4
1.7
1.4
10.5
10.5
1.7
1.6
NTPC
Neutral
183
-
151,181
86,070
101,246
28.3
30.7
12.9
16.2
14.2
11.3
1.5
1.4
10.6
12.4
3.1
2.8
Power Grid
Neutral
216
-
112,767
29,183
32,946
89.7
90.0
18.0
20.8
12.0
10.4
2.0
1.8
17.7
18.2
7.8
7.2
Real Estate
Prestige Estate
Neutral
287
-
10,779
4,607
5,146
21.0
22.2
7.9
9.8
36.4
29.3
2.2
2.1
10.3
12.0
3.5
3.2
MLIFE
Accumulate
468
522
2,402
487
590
12.3
17.8
21.0
31.2
22.3
15.0
1.2
1.1
5.2
7.4
3.6
3.0
Telecom
Bharti Airtel
Neutral
516
-
206,066
97,903
105,233
36.0
36.3
9.3
11.1
55.4
46.7
2.7
2.5
5.0
5.6
3.1
2.8
Idea Cellular
Neutral
99
-
35,726
35,012
37,689
27.1
27.7
(4.4)
(2.7)
1.5
1.6
(6.8)
(4.6)
2.3
2.1
zOthers
Abbott India
Neutral
4,198
-
8,920
3,244
3,723
14.9
16.1
167.5
209.4
25.1
20.1
5.5
4.6
23.7
24.8
2.4
2.0
Asian Granito
Buy
492
570
1,480
1,169
1,286
12.5
12.5
16.0
19.7
30.8
25.0
3.3
2.9
10.7
11.6
1.5
1.3
Bajaj Electricals
Neutral
381
-
3,865
4,646
5,301
6.7
7.6
16.1
22.3
23.6
17.1
3.9
3.3
16.4
19.2
0.8
0.7
Banco Products (India)
Neutral
215
-
1,539
1,530
1,695
13.2
12.7
19.0
20.0
11.3
10.8
1.8
1.6
0.2
0.2
0.9
101.7
Coffee Day Enterprises
Neutral
220
-
4,541
3,494
3,913
17.4
18.0
4.8
5.7
-
38.7
2.0
1.9
-
0.1
1.8
1.5
Ltd
Elecon Engineering
Neutral
70
-
789
171
201
15.0
16.2
36.0
43.0
2.0
1.6
0.2
0.2
0.1
0.1
4.0
3.4
Garware Wall Ropes
Neutral
904
-
1,977
928
1,003
15.2
15.2
39.4
43.2
22.9
20.9
3.8
3.2
16.5
15.4
2.0
1.8
Goodyear India*
Neutral
806
-
1,860
1,717
1,866
11.8
12.3
47.9
49.8
16.8
16.2
2.6
2.3
15.6
15.7
0.8
111.4
Hitachi
Neutral
2,440
-
6,633
2,355
2,715
10.3
10.8
49.0
60.9
49.8
40.1
11.7
9.2
0.2
0.2
2.8
2.4
HSIL
Neutral
418
-
3,025
2,240
2,670
14.6
15.0
17.0
22.0
24.6
19.0
2.0
1.9
0.1
0.1
1.6
1.3
Interglobe Aviation
Neutral
1,174
-
42,456
22,570
27,955
14.2
15.0
63.6
81.8
18.5
14.4
9.7
8.2
0.5
0.6
1.6
1.2
Jyothy Laboratories
Neutral
373
-
6,781
1,781
2,044
14.1
15.0
9.4
10.5
39.9
35.6
8.5
8.0
0.2
0.2
4.0
3.4
Linc Pen & Plastics
Neutral
249
-
368
420
462
9.3
9.3
15.3
17.1
16.3
14.5
2.7
2.8
16.9
19.5
0.9
0.8
M M Forgings
Neutral
853
-
1,030
542
642
20.1
21.0
41.6
56.8
20.5
15.0
2.8
2.4
0.1
0.2
2.3
2.0
Mirza International
Neutral
156
-
1,879
1,148
1,285
18.0
18.0
8.0
9.4
19.4
16.7
3.2
2.7
16.3
16.1
1.8
1.6
Navkar Corporation
Buy
198
265
2,817
561
617
41.5
41.5
11.5
12.7
17.2
15.5
1.8
1.6
10.5
10.4
5.7
5.0
Nilkamal
Neutral
1,607
-
2,398
2,317
2,525
11.4
11.1
96.0
105.0
16.7
15.3
2.8
2.5
0.2
0.2
1.0
0.9
Stock Watch
October 26, 2017
Company Name
Reco
CMP
Target Mkt Cap
Sales ( Čcr )
OPM(%)
EPS (Č)
PER(x)
P/BV(x)
RoE(%)
EV/Sales(x)
(Č)
Price ( Č)
( Č cr )
FY18E FY19E FY18E FY19E FY18E FY19E FY18E FY19E FY18E FY19E FY18E FY19E FY18E FY19E
zOthers
Parag Milk Foods
Neutral
269
-
2,264
1,987
2,379
7.6
9.0
12.4
18.3
21.7
14.7
3.1
2.7
8.2
13.2
1.3
1.1
Radico Khaitan
Neutral
211
-
2,803
1,811
1,992
13.2
13.2
8.1
8.8
26.0
23.9
2.6
2.9
10.1
12.0
1.9
1.7
Relaxo Footwears
Neutral
520
-
6,244
1,981
2,310
13.7
14.5
12.0
15.5
43.3
33.5
8.4
6.8
0.2
0.2
3.2
2.8
Siyaram Silk Mills
Buy
575
2,982
2,697
1,769
1,981
12.7
12.7
113.1
131.1
5.1
4.4
0.8
0.7
15.5
15.5
1.7
1.5
Styrolution ABS India* Neutral
1,011
-
1,778
1,800
1,980
8.0
8.1
42.0
46.2
24.1
21.9
2.7
2.4
0.1
0.1
1.1
1.0
Surya Roshni
Neutral
328
-
1,437
4,870
5,320
7.7
7.8
22.8
28.1
14.4
11.7
1.9
1.7
0.1
0.1
0.5
0.5
TVS Srichakra
Neutral
3,108
-
2,380
2,729
2,893
12.7
12.5
248.5
265.0
12.5
11.7
3.6
2.9
0.3
0.3
0.9
0.8
Visaka Industries
Neutral
687
-
1,091
1,104
1,214
12.1
12.6
31.0
37.9
22.2
18.2
2.7
2.4
0.1
0.1
1.2
1.1
VIP Industries
Accumulate
280
300
3,961
1,450
1,693
10.4
10.5
6.5
7.8
42.8
35.9
9.1
7.9
21.1
22.1
2.7
2.3
Navin Fluorine
Neutral
697
-
3,437
945
1,154
22.4
22.6
28.7
34.8
24.3
20.1
4.0
3.4
-
-
3.2
2.5
Source: Company, Angel Research; Note: *December year end; #September year end; &October year end; Price as on October 25, 2017
Market Outlook
October 26, 2017
Research Team Tel: 022 - 39357800
DISCLAIMER
Angel Broking Private Limited (hereinafter referred to as “Angel”) is a registered Member of National Stock Exchange of India
Limited,Bombay Stock Exchange Limited and Metropolitan Stock Exchange Limited. It is also registered as a Depository Participant with
CDSL and Portfolio Manager with SEBI. It also has registration with AMFI as a Mutual Fund Distributor. Angel Broking Private Limited is a
registered entity with SEBI for Research Analyst in terms of SEBI (Research Analyst) Regulations, 2014 vide registration number
INH000000164. Angel or its associates has not been debarred/ suspended by SEBI or any other regulatory authority for accessing
/dealing in securities Market. Angel or its associates/analyst has not received any compensation / managed or
co-managed public offering of securities of the company covered by Analyst during the past twelve months.
This document is solely for the personal information of the recipient, and must not be singularly used as the basis of any investment
decision. Nothing in this document should be construed as investment or financial advice. Each recipient of this document should make
such investigations as they deem necessary to arrive at an independent evaluation of an investment in the securities of the companies
referred to in this document (including the merits and risks involved), and should consult their own advisors to determine the merits and
risks of such an investment.
Reports based on technical and derivative analysis center on studying charts of a stock's price movement, outstanding positions and
trading volume, as opposed to focusing on a company's fundamentals and, as such, may not match with a report on a company's
fundamentals. Investors are advised to refer the Fundamental and Technical Research Reports available on our website to evaluate the
contrary view, if any.
The information in this document has been printed on the basis of publicly available information, internal data and other reliable
sources believed to be true, but we do not represent that it is accurate or complete and it should not be relied on as such, as this
document is for general guidance only. Angel Broking Pvt. Limited or any of its affiliates/ group companies shall not be in any way
responsible for any loss or damage that may arise to any person from any inadvertent error in the information contained in this report.
Angel Broking Pvt. Limited has not independently verified all the information contained within this document. Accordingly, we cannot
testify, nor make any representation or warranty, express or implied, to the accuracy, contents or data contained within this document.
While Angel Broking Pvt. Limited endeavors to update on a reasonable basis the information discussed in this material, there may be
regulatory, compliance, or other reasons that prevent us from doing so.
This document is being supplied to you solely for your information, and its contents, information or data may not be reproduced,
redistributed or passed on, directly or indirectly.
Neither Angel Broking Pvt. Limited, nor its directors, employees or affiliates shall be liable for any loss or damage that may arise from
or in connection with the use of this information.